1. Explain why the graph of f(x) = sin(x)+.01abs(sin(100x)) looks as it does.
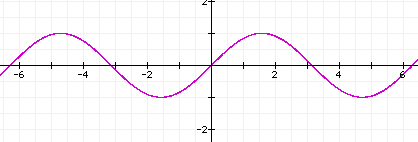
The graph of sin( ) is as shown below. As the argument of sin( ) varies from –2pi to –pi/2, sin( ) varies from 0 to 1 to 0 to –1. As the argument of sin( ) varies from –pi/2 to pi, sin( ) varies from –1 to 0 to 1 to 0. As the argument of sin( ) varies from pi to 2pi, sin( ) varies from 0 to –1 to 0.

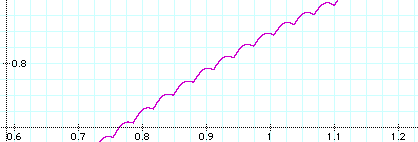
The graph of .01abs(sin(100x)) is as shown below (when blown up over a small interval). As (100x) varies through an interval of length pi, abs(sin(100x)) varies from 0 to 1 to 0. This means that abs(sin(100x)) varies from 0 to 1 to 0 as x varies through intervals of length pi/100.

The graph of sin(x) +.01abs(sin(100x)) will be identical to the graph of sin(x) where .01abs(sin(100x)) is 0 (i.e., at multiples of pi/100, and it will have little bumps between those points because of .01abs(sin(100x)) being added to sin(x) as x varies through each interval of length pi/100.

