Ms. Coombs
Math 1/2 1st Hour
September 8, 2006
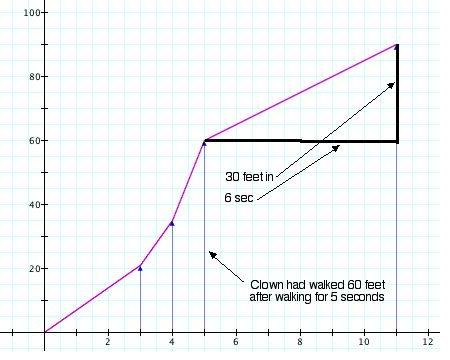
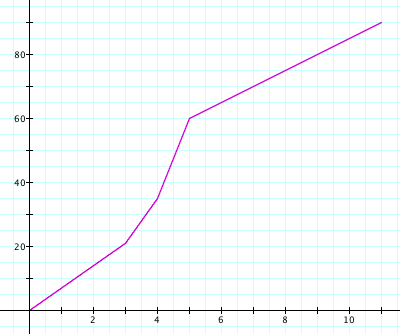
Here is a "pixie dust" record of clown's walk. The person making this kept track of the number of seconds elapsed with one finger moving horizontally and kept track of the number of feet Clown had walked with her other finger moving vertically.
Everything in Clown's table of distances and times can be found in this graph!
Graph
Diagram 1 (below) shows that in the first three seconds Clown traveled 21 feet. It also shows that in 1.5 seconds he traveled 10.5 feet, that in 2 seconds he traveled 14 feet, and so on. Assuming Clown walked at a constant speed in the first three seconds, we can say he walked at a speed of 7 ft/sec. This means that for any numer of seconds (x) between 0 and 3, Clown walked 7x feet.
Diagram 1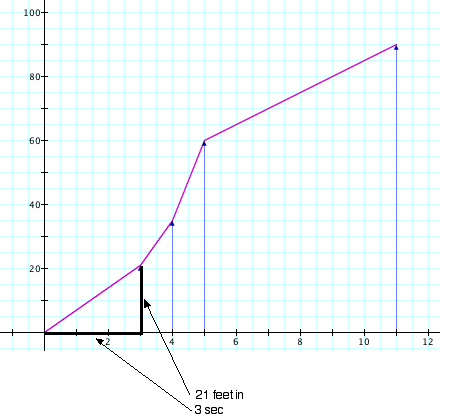
In Diagram 2 (below), we can see that after 3 seconds Clown had walked 21 feet, and in the next second he traveled an additional 14 feet. So in that next second, Clown traveled at a speed of 14 ft/sec (assuming he traveled at a constant speed). This means that for any number of seconds (x) between 3 and 4, Clown walked 14(x-3)+21 feet.
Diagram 2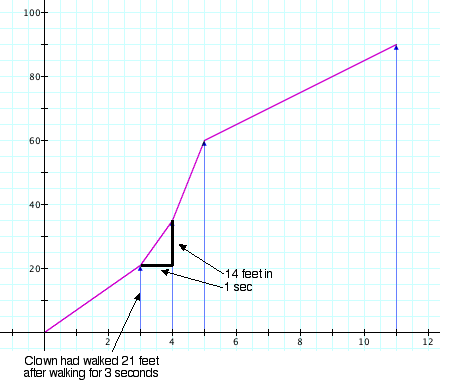
In Diagram 3 (below), we can see that after 4 seconds, Clown had walked 35 feet, and that in the next one second he walked an additional 25 feet. This means that he walked at a speed of 25 ft/sec during that one second (assuming he walked at a constant speed). So, for numbers of seconds (x) between 4 and 5, Clown walked 25(x-4)+35 feet.
Diagram 3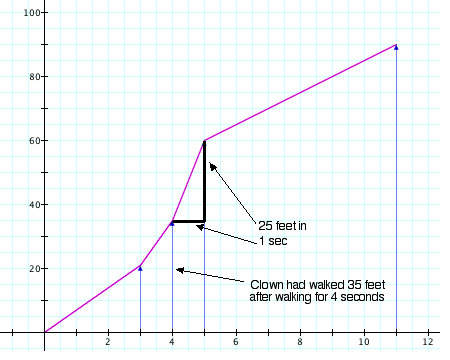
Diagram 4 (below) shows that Clown had walked 60 feet by the end of the 5th second and that he walked an additional 30 feet in the next 6 seconds. Assuming he walked at a constant speed, he walked at 5 ft/sec during these 6 seconds. So, for numbers of seconds (x) between 5 and 11, Clown walked 5(x-5)+60 feet.
Diagram 4