1.  One day Clown walked to the end of his path without
knowing that it is really a diving board 400 feet above a lake. He walked off the end and, of course, began falling.
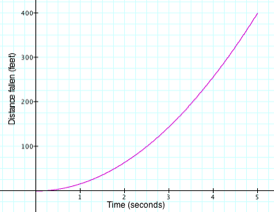
The graph below shows how far clown fell relative to the number of seconds
since he walked off the end.
One day Clown walked to the end of his path without
knowing that it is really a diving board 400 feet above a lake. He walked off the end and, of course, began falling.
The graph below shows how far clown fell relative to the number of seconds
since he walked off the end.
a) The
graph goes up, but Clown is falling down. How can this be?
b) The point
(2.3, 84.64) is on this graph. What does it represent?
c) Pick
a point on this graph and estimate its coordinates.
Point's
coordinates:
d) What does
this point represent?
e) What
does the graph tell you about the clown's speed as he fell to the lake relative
to the number of seconds he had fallen? How does it tell you this?
2.
Symone bungee jumped off a high bridge.
a) Sketch
a graph of her distance above the ground relative to the number of seconds
after she jumped (don't worry about accuracy; think about what happens
overall). Be prepared to explain your graph so that the class can understand
it.
b) Sketch a
graph of her speed as she fell relative to the number of seconds since she
jumped (don't worry about accuracy; think about what happens overall). Be
prepared to explain your graph so that the class can understand it.
c) Sketch a graph of her speed relative to how far above the ground she was. Do this up till the bottom of her 2nd bounce (don't worry about accuracy; think about what happens overall). Be prepared to explain your graph so that the class can understand it.
3.
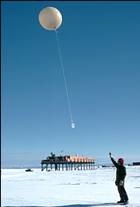 Steve Thompson of the National Oceanic and
Atmospheric Administration (NOAA) released a weather balloon over the Prince
William weather station in Alaska. What this picture does not show is that the
chord broke when the balloon was 5000 feet off the ground and the measurement
box fell to the ground.
Steve Thompson of the National Oceanic and
Atmospheric Administration (NOAA) released a weather balloon over the Prince
William weather station in Alaska. What this picture does not show is that the
chord broke when the balloon was 5000 feet off the ground and the measurement
box fell to the ground.
It is a fact that falling objects
speed up as they fall. But air resistance increases as the object speeds up. At
some point in time, air resistance becomes great enough that the object doesn't
speed up any more. In this case, the box stopped speeding up after 10 seconds.
a) Sketch
a graph of the weather box's speed in feet/second relative to the number of
seconds since the chord broke. Don't worry about accuracy. Think about what
happens overall and how your graph reflects it.
b) Sketch a
graph of the box's distance above the ground relative to the number of seconds
it had fallen. Make it consistent with the graph you created for part (a). Don't
worry about accuracy. Think about what happens overall and how your graph
reflects it.