Bungees Revisited
1. Watch the video of the girl who bungee jumped off a high bridge.
a) Sketch a graph of her distance from the bridge relative to the number of seconds after she jumped. Play the movie frame-by-frame, on the player and then in your mind, as you capture the fine-grained details of his jump. To play it frame-by-frame, pause the movie, then press right or left arrow to advance one frame). Don't worry about absolute accuracy.
b) Sketch a graph of her speed as she fell relative to the number of seconds since she jumped (don't worry about accuracy; think about what happens overall). Be prepared to explain your graph so that the class can understand it.
c) Sketch a graph of her speed relative to how far she was from the bridge. Do this up till the bottom of her 3rd bounce (don't worry about accuracy; think about what happens overall). Be prepared to explain your graph so that the class can understand it.
2.
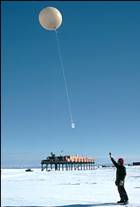 Steve Thompson of the National Oceanic and
Atmospheric Administration (NOAA) released a weather balloon over the Prince
William weather station in Alaska. What this picture does not show is that the
chord broke when the balloon was 5000 feet off the ground and the measurement
box fell to the ground.
Steve Thompson of the National Oceanic and
Atmospheric Administration (NOAA) released a weather balloon over the Prince
William weather station in Alaska. What this picture does not show is that the
chord broke when the balloon was 5000 feet off the ground and the measurement
box fell to the ground.
It is a fact that falling objects
speed up as they fall. But air resistance increases as the object speeds up. At
some point in time, air resistance becomes great enough that the object doesn't
speed up any more. In this case, the box stopped speeding up after 10 seconds.
a) Sketch
a graph of the weather box's speed in feet/second relative to the number of
seconds since the chord broke. Don't worry about accuracy. Think about what
happens overall and how your graph reflects it.
b) Sketch a
graph of the box's distance above the ground relative to the number of seconds
it had fallen. Make it consistent with the graph you created for part (a). Don't
worry about accuracy. Think about what happens overall and how your graph
reflects it.