In class Activity
070423
1.
You just got your license and have been flirting with speed a
lot. You decide to take the
freeway, and while driving you realize you are traveling at 80 mph; write a
function that relates the number of miles traveled with the number of hours
elapsed.
2.
Graph your function and label your axes.
3.
What is your rate of change for this scenario?
4.
Create a table of values that shows the rate of change relative to the hours traveled.
5.
Write the function represented by your table use r for rate of change.
6.
Graph your function and label your axes.
Relating rate of
change
Homework
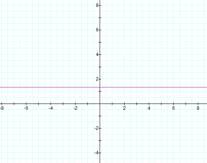
The following graphs relate the rate of change of a function
to the x value of the function. Sketch a graph of the original
function. Write the equation of
the given line and your sketch.
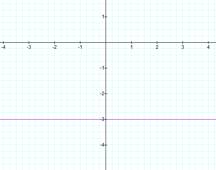
 1.
Let
the y-intercept equal 2.
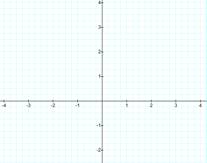
1.
Let
the y-intercept equal 2.
Equation Equation
2. Pick
a value for the y intercept.
Equation Equation
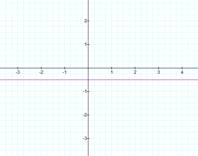
3.

Equation Equation
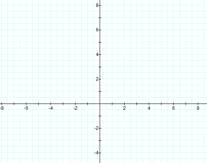
Below is a graph that relates the rate of change of a
function to the x value of a function
Create a table of values for the given line. Use the table to sketch the original function.
4.