|
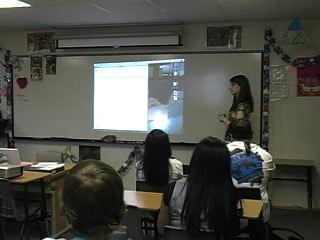
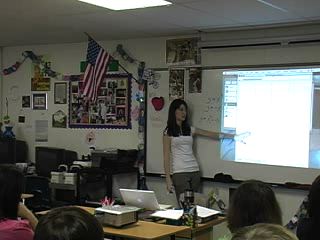
In this clip we join Ms. Coombs as she works
with the students on exploring graphs of the
functions y=x2 and y=x3
near x=0.
|
|
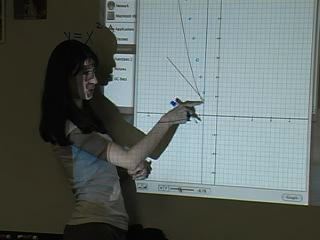
To further explore the “flat” behavior near
the origin of the monomial functions, Ms.
Coombs directs the students to consider
y=x6. The function of this graph,
in a standard window, looks so flat near the
origin that the x-axis and the function
become indistinguishable.
|
|
Following the classroom instruction Ms.
Coombs and Pat meet to discuss the lesson.
|
|
In a second clip from the post-class
meeting, Pat explains to Ms. Coombs what he
means by having the students think about
moving slowly across the domain.
|
|
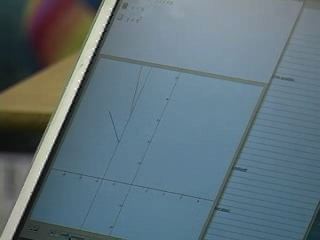
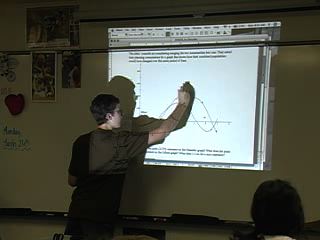
Ms. Coombs tries to use Pat’s ideas and
directs the students to take baby steps to
construct a graph that results from adding
the function y=-x and y=x2.
|
|
As the class proceeds, students continue to
take “baby steps” across the x-axis and
estimate the specific values of the
functions to find the sum of the two
functions.
|

|
The procedure of step-by-step estimations
that Ms. Coombs began in the previous clip
continued on for three minutes. In this clip
she begins to employ a form of covariational
reasoning to help construct the graph of the
sum of the functions.
|

|
In the after class meeting, Pat discusses
with Ms. Coombs how precise numerical values
are extra details. The students can, in
fact, focus on estimated magnitudes to help
construct the graph of the sum.
|
|
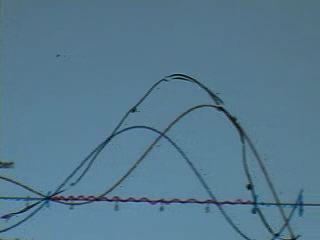
Ms. Coombs employs Pat’s idea of using a
graph without scales to help students focus
on the important aspects of what it means to
add functions.
|

|
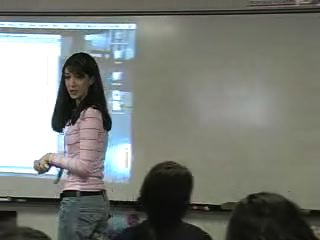
After students have completed their
worksheet, Ms. Coombs guides a discussion of
finding the sum of the two functions using
an unmarked ruler to estimate magnitudes.
|
|
On this clip, Ms. Coombs continues to
generate the sum of the two given functions.
|
|
After having time to work on the task,
Casey, one of the students, places his work
on the board. In this clip, Ms. Coombs
directs a classroom discussion to review
Casey’s work. She focuses on particular
intervals and landmark points on the graph.
|
|
In this clip we see Ms. Coombs continue to
work the task dealing with how populations
changed over time.
|
|
In this clip we see Ms. Coombs continue to
work the task dealing with how populations
changed over time.
|
