Day 1 Clip 1
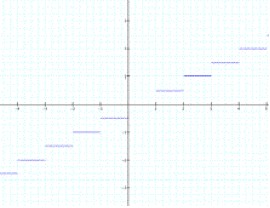
In this first clip we see Ms. Coombs focus
students’ attention on rate of change.
|
Day 1 Clip 2
Ms Coombs continues to work through the
earlier task.
|
Day 1 Clip 3
After giving students time to work on the
problem, Ms. Coombs continues the discussion
of the rate of change step function.
|
Day 1 Clip 4
Ms. Coombs leads the class in thinking about
the impact of changing the step interval on
the rate of change graph from 1 to ½ units.
|
Day 1 Clip 5
In this clip, Ms. Coombs asks students what
they meant by “more specific.” She leads
into this question by pushing the step size
down to 0.1 units.
|
Day 1 Clip 6
Ms. Coombs continues to ask students about
what happens to the rate of change graph and
the resulting function graph as the interval
size gets smaller and smaller.
|
Day 1 Clip 7
Using the Graphing Calculator software, Ms.
Coombs shows students what happens to the
graph of an original function when the step
size decreases on its corresponding rate of
change graph.
|