|
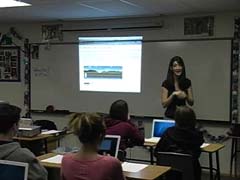
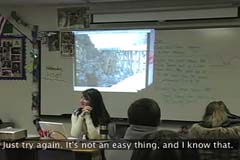
Ms. Coombs begins this lesson sequence in
her regular Algebra I class with an activity
involving a computer tool that displays the
back and forth motion of a character named
Clown.
|
|
This portion of the class occurs immediately
after Ms. Coombs asks the class to work in
pairs on the activity described in the
previous clip.
|
|
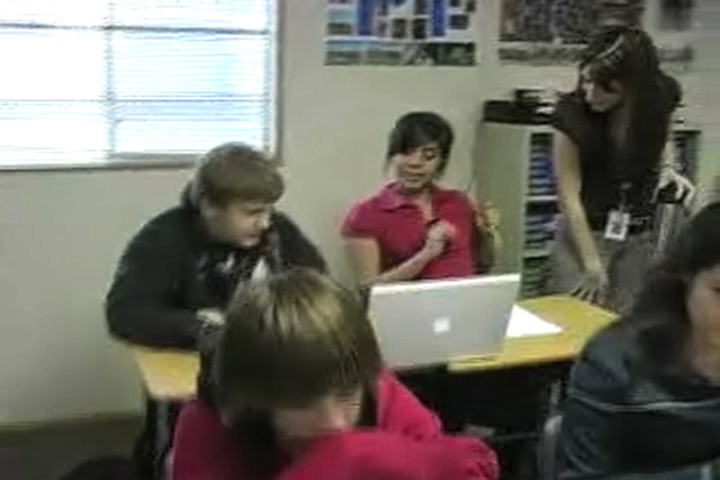
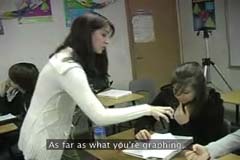
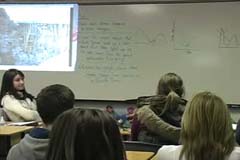
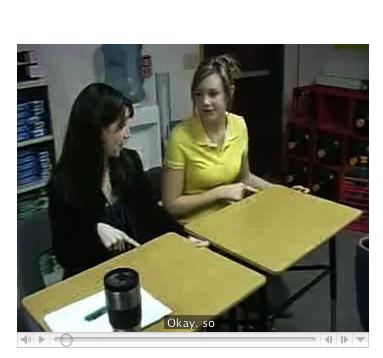
This segment shows Ms. Coombs working with
another pair of students as they try to
create the graph of Clown’s walk as
described on the activity sheet introduced
previously.
|
|
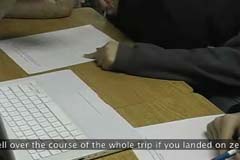
As a result of her interactions with the
students (see Clip 2 and 3), Ms. Coombs
realized that the students were engaging in
the task without using the finger tool.
|
|
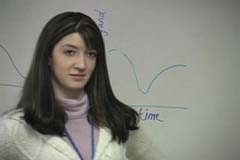
In day two of the lesson sequence, Ms.
Coombs re-visits Clown by focusing on a
graph of Clown’s walk showing his distance
from start as a function of time.
|
|
On day two of the lesson sequence Ms. Coombs
assigned a homework activity in which
students were asked to explore Rubin’s walk
by examining the function that represented
his walk.
|
|
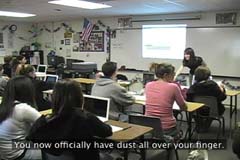
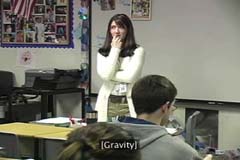
In this clip, at the beginning of day four,
Mrs. Coombs discusses an assignment from the
previous day in which the students were
first asked to watch a video of Clown.
|
|
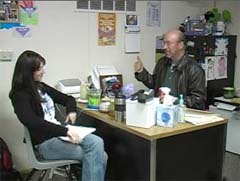
After the lesson on day four, Ms. Coombs and
Dr. Thompson discussed the importance of
making sure that the ways of thinking
entailed in using finger tool were a part of
all conversations.
|
|
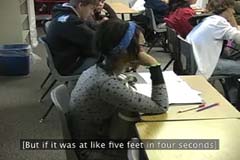
In this segment, students work in pairs to
graph the bungee jumper's distance from the
ground relative to the number of seconds
since she jumped..
|
|
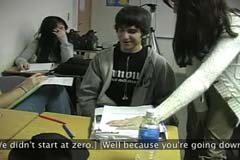
This segment shows Ms. Coombs working with
another pair of students as they continue
their worksheets.
|
|
Prior to day six, Ms. Coombs and Dr.
Thompson discussed the need for classroom
rules to guide discussions about moving
objects.
|
|
In this segment, also from day six, the
class continues discussing the video of a
bungee jumper.
|
|
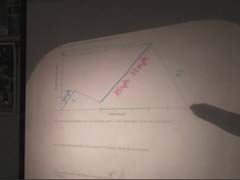
In this third video clip from day six, Ms.
Coombs asks the students to watch a replay
of the bungee jumping video while referring
to three student-generated graphs of the
relationship of changes in time and changes
in vertical distance from the ground.
|
|
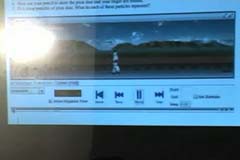
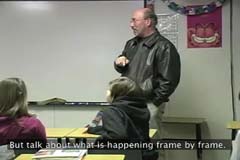
In this fourth segment from day six, Ms.
Coombs asks students to refer to the
frame-by-frame version of the bungee jumping
video in order to discuss how the
student-generated graphs show speed.
|
|
After discussing Day Six with Dr. Thompson,
Ms. Coombs agrees that the students appear
to be graphing the path of the jump instead
of thinking about co-varying quantities.
|
|
Dr. Thompson then agrees to teach the lesson
on Day 7 in which he revisits the bungee
jumping task, but changes the quantity on
the vertical axis from distance from the
ground to distance from the bridge.
|
|
In the clip shown here, Ms. Coombs works
one-on-one with a student who is trying to use
the finger tool to show the relationship of the
bungee jumper's distance from the bridge as a
function of time.
|
